You don’t have to labor for hours to design charts and graphs in your reports. By using the intuitive Power BI tools, you can use drag-and-drop gestures to create stunning visual reports in a few minutes.
Power BI Tables are a great choice:
To view and compare detailed data and exact values (instead of visual representations).
To display data in a tabular format.
To display numerical data by categories.
These visuals can be created and viewed in both Power BI desktop and Power BI service.
The steps and illustrations in this article are from Power BI Desktop.
Let's Go! 😃
Considering the example for listing out the 1000 best film.
Started by loading a dataset to Power BI Desktop.
Used the Get Data menu to connect to a dataset from a file, database, or online source. Here, I will be connecting to Excel data List of Films.xlsx .
The preview of the data is shown, and once I was satisfied that I am loading the right file, clicked Load.
I have loaded the file, and saved as Citizen bloody Kane
again. The Fields pane contains the variables of the data.
Now, I selected the table chart in the Visualization pane, and it created a default table in the canvas. Nothing is displayed yet because I have to add the required columns in the table.
The next step is to fill the arguments under the Values option. The columns required in the table were Pos, Title, Director, Mins.
So, I clicked on the table visualization and selected the respected columns from the field pane and it was automatically added to the values option and table.
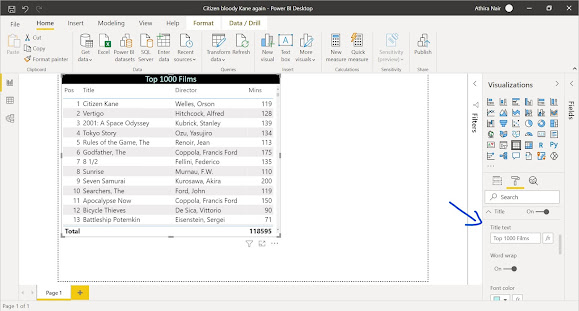
The required table with 1000 top films is ready.
Now lets make it look more clean and stylish. 😉
So I customized the table changing column header's and value's font size, adding title for the table, changing the background and font color for Subtotal values and title using Format in Visualization Pane.
By adding and customizing the title, the table looked somewhat like
this:
Next, I changed the color of Total label and
value from the Format pane.
So, as per the requirement, now the films are
sorted by Positions and the table has a title and totals.


good Athira
ReplyDeletevery nice
ReplyDelete